Browse through our Journals...
Current demand for ENT outpatient services in the UK
A.J. Kinshuck, MRCS, DOHNS1
SG Derbyshire, DOHNS1
M Wickham, MBChB1
THJ Lesser, MBBS, MS, FRCS1
1 Department of Otolaryngology and Head & Neck Surgery, University Hospital Aintree, Liverpool, UK
CORRESPONDING AUTHOR
Mr Andrew J Kinshuck MRCS, DOHNS
Department of Otolaryngology and Head and Neck Surgery, University Hospital Aintree, Longmoor Lane, Liverpool, L9 7AL, United Kingdom
ABSTRACT
Objective: This study assessed which patients are referred to ENT and what is done for them. The ultimate aim is to improve how we plan and provide ENT hospital services.
Method: A 6 month retrospective study was completed of all ENT referrals from a single GP practice.
Results: There were 135 patients referred during this period as non-emergencies to the ENT department. 115 patients were seen in clinic with an age range of 2 months to 88yrs. The subspecialty breakdowns of the patients seen were as follows: Otology 40%, Rhinology 31%, Laryngology 21% and Head & Neck surgery 8%. In the clinic 70% of the patients had some sort of procedure. There were eighteen patients (16%) required complex imaging. Twenty one (18%) of the total patients seen, were listed for surgery.
Conclusion: The GP’s main requirement from an ENT department is an extended examination and appropriate investigations to provide a diagnosis and prognosis. Only 18% of patients were listed for surgery following an ENT outpatient appointment.
KEYWORDS:
GP, ENT referrals, outpatients, NHS, demand
INTRODUCTION
In the UK the vast majority of ENT problems are treated by the GP without any reference to ENT. According to the national HES data, ENT departments in England see 1,125,550 new patients and add 274,472 patients to the waiting list per annum. 1 There are also 67,727 ENT emergencies seen which account for 19% of ENT admissions. However what we do not know is what these patients’ symptoms are and what happens to them once referred to the ENT department.
There has been previous analysis of referrals of specific symptoms however no published review of the total ENT referrals from a single practice. 2 This information is important as we cannot design a hospital service without knowing what the demands are.
ENT is such a diverse speciality that there will be a variety of needs in different parts of the country. 3 Regional variations will sometimes relate to service demands and to individual services. For instance, there are some services which deal with all of the head and neck skin cancers and skin lesions and others that deal with very little of this. This accepted general ENT accounts for the vast majority of our work and this work comes from the GP.
METHODS
This retrospective study looked at GP practice referrals over a period of six months, from the 1st March 2008 – 31st August 2008. A large practice was chosen with just over thirteen thousand patients. The practice refers all of its ENT patients to the University Hospital Aintree and children to Alder Hey Hospital. Examining the details of these patients would allow us to look at the service needs and in particular what types of service we should be providing. All GP referral letters to ENT were reviewed as were the follow up clinic letters from outpatients. This enabled us to find out what happened to the patients after they were referred. Where possible the results were compared to the national data.
RESULTS
During this six month period 135 non-emergency patients were referred to the ENT department. 115 patients were seen in clinic. The age range was 2 months to 88yrs with the mean age being 43 yrs. There were a total of sixty-three males and seventy-two females. The average number of referrals from this practice per month was 21 patients. The referral rate was 2.1% per annum of the practice population. This matches the national data which also has a referral rate of 2.1% of the population of England.1 shows the number of ENT referrals per month.
Reviewing the adult referrals more closely there were 109 adults referred with 91 of them seen in clinic. There were eight patients who failed to attend (7.3%) and 5 cancellations. There were also three patients seen at a different hospital, one seen privately and one patient referred incorrectly.
Looking at the paediatric attendance there were 26 children were referred with 24 seen in clinic. There was only one patient who failed to attend (4%) with one seen in the dressing clinic.
In the adult clinic 69 (76%) patients were seen by consultants and 22 (24%) patients seen by SpR’s. The patients were seen by 11 different consultants.
In the Paediatric clinic 12 (50%) patients seen by consultants and 12 (50%) patients were seen by SpR’s. The children were seen by three different consultants.
The subspecialty breakdown is demonstrated in figure I. It shows the total number of patients seen in clinic. The pie chart shows Otology followed by Rhinology to be the most popular GP referral. Of note there were four patients seen with two subspecialty problems.
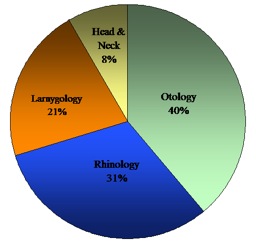
Figure 1:Subspecialty breakdown
The breakdowns of the subspecialty presenting symptoms are listed below. The presenting symptoms are listed in numerical order for each subspecialty. The numbers in brackets are the number of patients referred with each symptom.
The Otology referrals included:
• Hearing loss (15), tinnitus (12), otorrhoea (11), vertigo (9), otalgia (6), ear fullness (2), wax (1)
The Rhinology referrals included:
• Nasal obstruction (15), epistaxis (10), snoring (9), cosmesis (4), post nasal drip (3), nasal discharge (3), nasal pain (2), nasal lesion (1), anosmia (1)
The Laryngology referrals included:
• Odynophagia (9), hoarseness (7), globus (5), dysphagia (3), cough(2) haemoptysis(1), dry mouth(1), halitosis(1)
The Head & Neck Referrals included:
• Neck swelling (9), skin lesions (2), facial swelling (2), headaches(1), facial pain(1)
So what happens to these patients?
Of the 115 patients seen in the ENT clinic 70% of them had some sort of diagnostic or treatment procedure. There were thirty six (31%) endoscopic examinations. This included both laryngoscopy and rigid nasoendoscopy. There were twenty five patients (22%) needed a pure tone audiogram, eleven (10%) needed aural microscopy, four nasal cautery, three had hearing aids and two skin testing. Three patients also had maneuvers for vertigo.
Eighteen patients (16%) required complex imaging, ten of these had CT scans of the sinuses, two had barium swallows, two had MRI’s of the IAM, one a CT of the temporal bone, one an ultrasound of the thyroid, one a submandibular sialogram, one a CT of parotid gland.
The next question is how many patients required surgical intervention. Twenty one (18%) of the total patients seen, were listed for surgery. This can be broken down into fifteen adult patients listed for surgery and six children added to waiting list. There were two adult patients offered surgery but declined.
Of the forty seven otology patients only four required surgical management which was 9% of all new ear referrals. Of the thirty-eight rhinology patients seen, ten required surgery which was 26% of all the nasal referrals. Of the thirty-six laryngology/head and neck patients seen, seven required surgery which was 19% of throat referrals.
During this time only four patients, one adult and three children (3%) of the surgical workload of the department from this GP Practice were tonsillectomies, which certainly represent a decrease from historical figures. The total numbers of tonsillectomies, all age groups, in 1994-95 were 77,604 tonsillectomies and in 2008-09 there had decreased to 49,187 tonsillectomies in England. 1
DISCUSSION
The main findings of this audit are that the GP’s main requirement from an ENT department is an extended examination and appropriate investigations to provide them with a diagnosis and prognosis. They also need us to manage some of the patients surgically but this is only 18% of the patients.
For an otologist (with this as their only surgical interest) you have to see approximately ten new patients for every operation that is needed, for a rhinologist you have to see four new patients for every nasal operation and for a laryngologist/head and neck surgeon you need to see five new patients for every operation that is required. This gives us some insight into how we would have to design our services in the future. Knowing that this is the demand from GP’s will help us design the service and does emphasise the need for high level outpatient services.
The GP’s also want us to provide a 24/7 emergency service. So far the emergency referrals have not been mentioned in this audit. In total there were 20 emergency referrals made from this GP practice to ENT in this time period. There were 14 adults and 6 children referred. As has been previously demonstrated relative few of them need operative surgery but many need procedures in the clinic/ward such as cautery, aural toilet or manipulation of nasal fracture. 4 From the national data only 11% of the total emergencies admitted to hospital required an operation. 1
Some missing data from this audit would be patients referred to ENT via another specialty such as dermatology and endocrinology. This would be a different study looking at those patients that need treatment from tertiary referrals. It is also possible that some patients that are still being investigated will be listed after the audit has finished. This may account for the difference between the National Listing rate of 25.4% and our listing rate of 18%. All the patients were seen by consultants or registrars under direct supervision, so it is also possible that the listing criteria were stricter than departments that have a more mixed staff.
The biggest lesson looking through this data and understanding it is that GP’s send in a large number of patients, despite treating the majority of ENT themselves and only a small proportion of these will need surgery but most need specialist investigation.
CONCLUSIONS
We know that the majority of ENT complaints are seen and managed by GP’s. The requirement from ENT outpatients department is in extended examination and investigation of the patient. In this audit 70% of patients had procedures in clinic with 16% of new patients requiring imaging. However there were only 18% of new patients are managed surgically.
ACKNOWLEDGEMENTS
The authors would like to thank Aintree Park Group Practice for the participation. The Orrell Park Surgery, 46 Moss Lane, Orrell Park, L9 AL
REFERENCES
1. Department of Health. Hospital Episode Statistics, England: financial year 2008-9. www.hesonline.nhs.uk
2. Bird JC, Beynon GJ, Prevost AT, Baguley DM. An analysis of referral patterns for dizziness in the primary care setting. British Journal of General Practice, 1998, 48,1828-1832
3. Baohns (2001), ENT Services 2008. ‘The provision of Otorhinolaryngology and Head and Neck Surgery in England.’ BAOHNS Publication, UK.
4. Evidence Based Emergency ENT Care, Sankalap Tandon and Tristram Lesser. Published 2007 by Options Medical Limited
Copyright Priory Lodge Education 2010
First Published May 2010
Click
on these links to visit our Journals:
Psychiatry
On-Line
Dentistry On-Line | Vet
On-Line | Chest Medicine
On-Line
GP
On-Line | Pharmacy
On-Line | Anaesthesia
On-Line | Medicine
On-Line
Family Medical
Practice On-Line
Home • Journals • Search • Rules for Authors • Submit a Paper • Sponsor us
All pages in this site copyright ©Priory Lodge Education Ltd 1994-


