Browse through our Journals...
Development of LC-MS Method for the Determination of Venlafaxine Hydrochloride in Human Plasma and its Application in Bioequivalence Studies
Aravindraj joghee1, Gopinath ram1, Rajan Sekar1, Mahesh Kumar Siddaiah2, Nanjan Moola Joghee2, Suresh Bhojraj3
1. CADRAT, JSS college of Pharmacy, Rocklands, Ootacamund – 643 001 , India
2. TIFAC CORE, JSS college of Pharmacy, Rocklands, Ootacamund – 643 001, India
3. Principal , JSS college of Pharmacy, Rocklands, Ootacamund – 643 001, India
ABSTRACT:
A rapid and sensitive liquid chromatography–mass spectrometry (LC–MS) method has been developed and validated for quantification of Venlafaxine hydrochloride (VEN) in human plasma. The analyte was extracted from human plasma by simple precipitation technique. Cetrizine (CET) was used as the internal standard. A kromasil C18 column provided chromatographic separation of the analyte which was followed by detection with mass spectrometry. The mass transition ion-pair was followed as m/z 278.0 for VEN and m/z 388.9 for CET. The method involves precipitation of VEN from plasma, simple isocratic chromatography conditions and mass spectrometric detection that enables detection at nanogram levels. The proposed method has been validated with linear range of 5–250 ng mL for VEN. The precision and accuracy values are within 10%. The overall recovery of VEN was 95.9 %. Total elution time was as low as 4.0 min. The developed and validated method was successfully applied for the bioequivalence studies of VEN sustained release capsules.
KEYWORDS:
Venlafaxine; LC–MS; Human plasma; Bioequivalence
INTRODUCTION
VEN, 1-2-(dimethylamino)-1-(4-methoxyphenyl) ethyl-cyclohexanol hydrochloride is a new phenethylamine bicyclic antidepressant, which has a neuropharmacologic profile distinct from that of existing antidepressants including tricyclic compounds. It imparts antidepressant effects by inhibiting the neuronal uptake of norepinephrine, serotonin and dopamine and lacks the adverse side effect profile of tricyclic antidepressants VEN is well absorbed in humans and undergoes extensive metabolism in the liver and has several metabolites, one of which is biologically active. VEN is extensively metabolized to O-desmethyl venlafaxine (ODV), a major metabolite with an activity profile similar to that of VEN. It is therefore important to monitor plasma concentration of VEN to establish pharmacokinetic parameters.
Different methods have been reported in literature for monitoring plasma levels of VEN and ODV (1, 5-14). The analytical method reported requires laborious extraction procedure like liquid–liquid extraction or solid-phase extraction (SPE) involving drying and reconstitution, long run time and high quantification limit. It is necessary, therefore, to develop a simple, specific, rapid and sensitive analytical method for the quantification of the VEN and its active metabolite ODV.
This paper describes development and validation of a simple, specific, rapid and sensitive LC-MS method for the determination of VEN in human plasma with a limit of quantification (LOQ) of 5 ng mL for VEN with a run time of 7.0 min using CET (Fig. 1), as internal standard. The method was applied to the quantification of VEN in a single dose, crossover bioequivalence study of sustained release capsules of VEN containing 75 mg of VEN in healthy male human subjects.
METHOD
Chemicals and reagents
The reference standards of VEN (purity: 99.67%) and CET (purity: 98.44%) were obtained from Neo Pharma, (Abu Dhabi, UAE) and Aurobindo Pharma (Hyderabad, India) respectively. High purity water was prepared in-house using a Milli-Q water purification system obtained from Millipore (India) Pvt. Ltd. (Bangalore, India). HPLC grade methanol and acetonitrile were purchased from E. Merck Ltd. (Mumbai, India). Drug free (blank) heparinized human plasma was obtained from a local Nursing home (Ootacamund, India) and was stored at −20 °C prior to use.
Calibration curves
The Stock solutions of VEN and CET were prepared in acetonitrile at free base concentration of 1000 µg mL. Secondary and working standard solutions were prepared from stock solutions by dilution with water: acetonitrile (50:50, v/v). These diluted working standard solutions were used to prepare the calibration curve and quality control samples. Blank human plasma was screened prior to spiking to ensure it was free of endogenous interference at retention times of VEN and the internal standard CET. A seven point standard curve of VEN was prepared by spiking the blank plasma with appropriate amount of VEN. The calibration curve ranged from 5.0 to 250.0 ng mL. Quality control samples were prepared at three concentration levels of 20.0, 100.0 and 200.0 ng mL for VEN. The samples were vortexed and stored at –70 ± 2 0C until processing.
Sample preparation
A 0.5 ml aliquot of human plasma sample was mixed with 0.1 mL of internal standard working solution (2000.0 ng mL of CET) and 1 ml of acetonitrile (precipitating agent). The resulting solution was vortexed for 5 minutes and centrifuged at 4000 rpm for 10 min. Supernatants from the above solutions were separated and used for the analysis. 5 μL of the eluent was injected into the LC–MS system.
Instrumentation
Chromatographic separation was carried out in Shimadzu HPLC with Kromasil C18 (100 x 4.6 mm i.d., 5μ), column, purchased from Shimadzu Corporation, Japan. A mobile phase consisting of a mixture of acetonitrile and water (90:10%v/v) was used with a flow rate of 0.5 mL min. The total run time for each sample analysis was 7.0 min. Mass spectra were obtained using a Single Quadrupole Mass Spectrometer (Shimadzu, Japan), equipped with Atmospheric Pressure Chemical Ionization (APCI) source. The mass spectrometer was operated in the selected ion-monitoring (SIM) mode. Sample introduction and ionization was done in the positive ion mode. The spray voltage and capillary temperature were 1.3 KV and 400º C, respectively. The mass transition ion-pair was selected as m/z 278.0 for VEN and m/z 388.9 for CET. The data acquisition was ascertained by LC-MS solution data station. For quantification, the peak area ratios of the target ions of the drugs to those of the internal standard were compared with weighted (1/amount) calibration curves in which the peak area ratios of the calibration standards were plotted versus their concentrations.
Validation
The method was validated for selectivity, sensitivity, linearity, precision, accuracy, and stability. The selectivity of the method was evaluated by comparing the chromatograms obtained from the samples containing VEN and the internal standard with those obtained from blank samples. Sensitivity was determined in terms of LLOQ (Lower Limit of Quantification) where the response of LLOQ was at least five times greater than the response of interference in blank matrix at the retention time or mass transitions of the analyte. For linearity, different concentrations of standard solutions were prepared to contain 5.0 ng mL to 250.0 ng mL of VEN containing 2000.0 ng mL of CET. These solutions were analysed and the peak areas and response factors were calculated. The calibration curve was plotted using response factor vs concentration of the standard solutions. Standard curve fitting was determined by applying the simplest model that adequately describes the concentration-response relationship using appropriate weighing and statistical tests for goodness of fit. The precision of the method was determined by intraday precision and interday precision. The intra-assay precision and accuracy was calculated for five replicates at each Lower Limit of Quantification (LLOQ), Low Quality Control (LQC), Middle Quality Control (MQC) and High Quality Control (HQC) levels, each on the same analytical run, and inter-assay precision and accuracy was calculated after repeated analysis in three different analytical runs. The results are given in Table 1.
Accuracy of the developed method was determined by relative and absolute recovery experiments. The relative recovery of the drug was calculated by comparing the amount of the drug obtained from the drug supplemented plasma with the actually added amount. Recovery studies were carried out for three levels at six times and the percentage recovery, mean, standard deviation and coefficients of variation were calculated.
As part of the method validation, stability studying was carried out. Room temperature stock solution stability, refrigerated stock solution stability, freeze thaw stability, short term stability and long term stability were determined. Room temperature stock solution stability was carried out at 0, 3 and 8 hours by injecting four replicates of prepared stock dilutions of VEN equivalent to middle quality control sample concentration and the stock dilution of internal standard equivalent to the working concentration. Comparison of the mean area response of VEN and internal standard at 3 and 8 hours was carried out against the zero hour value. Refrigerated stock solution stability was determined at 7, 14 and 27 days by injecting four replicates of prepared stock dilutions of the analyte equivalent to the middle quality control sample concentration and the stock dilution of internal standard equivalent to the working concentration. The stability studies of plasma samples spiked with VEN were subjected to three freeze - thaw cycles, short term stability at room temperature for 3 h and long term stability at – 70o C over four weeks. In addition, stability of standard solutions was performed at room temperature for 6 h and freeze condition for four weeks. The stability of triplicate spiked human plasma samples following three freeze thaw cycles was analysed. The mean concentrations of the stability samples were compared to the theoretical concentrations. The stability of triplicate short term samples spiked with VEN was kept at room temperature for 1.00 to 3.00 h before extraction. The plasma samples for long term stability were stored in the freezer at 70 0C until the time of analysis (4).
RESULTS AND DISCUSSION
Method Development
The objective of this work was to develop and validate a simple, rapid and sensitive assay method for the quantification of VEN, suitable to determine the pharmacokinetics in clinical studies. To achieve the objective, different options was evaluated to optimize sample extraction, detection parameters and chromatography during method development. The standard solutions of VEN were analysed by LC-MS system using direct injection probe with ESI and APCI interfaces. From the mass spectrum recorded, the detection molecular ion selected was 278.0 for VEN and 388.9 for CET. Full scan mass spectrum of VEN and CET are given in Fig 4 and 5.
Optimization of the chromatographic conditions
Optimization of the chromatographic conditions are intended to take into account the various goals of method development and to weigh each goal (resolution, runtime, sensitivity, peak symmetry, etc) accurately, according to the requirement of LC-MS and HPLC methods being used for the estimation of drugs in biological fluids.
Different mobile phases, namely, acetonitrile, methanol and tetrahydrofuran in aqueous phase were used at a flow rate of 1.0 or 0.5 mL min. For the initial separation conditions, acetonitrile was used because of its favorable UV transmittance, low viscosity and better solubility. When acetonitrile was substituted by other solvents, the solvents to buffer ratios were calculated using solvent strength. The resulting ratios of the mobile phase were prepared and the drugs chromatographed. These mobile phases gave well retained and symmetrical peaks. Tetrahydrofuran was not selected due to its UV cut off wavelength of (215 nm). Methanol or acetonitrile was used as the mobile phase for further studies. The standard solution was chromatographed with mobile phases of different ratios of organic and aqueous phases at a flow rate of 1 mL/min or 0.5 mL min. Water: acetonitrile in the ratio of 10: 90 was selected as the mobile phase.
Different reversed phase stationary phases (C4, C8, and C18) were used and the chromatograms were recorded. Based on the retention and peak shape, Kromasil C18 column was selected for VEN. Typical chromatogram of VEN and CET are given in Fig. 2.
Validation
Estimation of VEN in plasma samples from the volunteers was carried out using optimized chromatographic conditions. The validation parameters such as accuracy, precision (repeatability and reproducibility), linearity and range, sensitivity (limit of detection and limit of quantitation), robustness/ruggedness, stability, selectivity/specificity and system suitability were evaluated. The validation results are given in Table 1 and 2.
Accuracy
The accuracy of the optimised methods was determined by relative and absolute recovery experiments. The percentage recovery values for VEN ranged from 86.95 to 87.59%, and their relative recovery values from 88.60 to 89.28%. The coefficient of variation (%) of these values was less than 10.00%. It is indicative that the developed methods are accurate and reliable.
Precision
The optimized method for the estimation of VEN was found to be precise. This was evident from the coefficient of variation values, which were less than 10.00% at all concentrations. The validation results are given in Table 1.
Selectivity
The selectivity of the method was evaluated by comparing the chromatograms obtained from the samples containing VEN and the internal standard with those obtained from blank samples. These chromatograms were compared with the chromatograms obtained from standard solutions. Each chromatogram was tested for interference. The combination of the sample preparation procedure and chromatography provided an assay which is free from significant interfering endogenous plasma components at the retention times of the selected drugs and the internal standard. These observations show that the developed assay method is specific and selective as given in Fig. 3.
Linearity
It was observed that the optimised methods were linear within a specific concentration range for VEN. The calibration curves were plotted between response factor and concentration of the standard solutions. The linearity ranges were found to be 5.00 to 250.00 ng mL-1. The calibration curves were constructed on 11 different days over a period of four weeks to determine the variability of the slopes and intercepts. The results indicated no significant interday variability of slopes and intercepts over the optimised concentration range.
Limit of Detection
The limit of detection (LOD) value was found to be 1.00 ng mL for VEN and their limit of quantification (LOQ) value was 5.00 ng mL. These observations indicate that the developed methods have adequate sensitivity. This value, however, may be affected by the separation conditions (eg. column, reagents, and instrumentation and data systems), instrumental changes (eg. pumping systems and detectors) and use of non HPLC grade solvents and may result in changes in signal to noise ratios.
Ruggedness and Robustness
The ruggedness and robustness of the methods were studied by changing the experimental conditions. No significant changes in the chromatographic parameters were observed when changing the experimental conditions (operators, instruments, source of reagents and column of similar type) and optimised conditions (pH, mobile phase ratio and flow rate).
Stability studies
The stability studies of plasma samples spiked with selected drugs were subjected to three freeze-thaw cycles, short term stability at room temperature for 3 h and long term stability at – 70 oC over four weeks. In addition, stability of standard solutions was performed at room temperature for 6 h and freeze condition for four weeks. The mean concentrations of the stability samples were compared to the theoretical concentrations. The results indicate that selected drugs in plasma samples can be stored for a month without degradation in frozen state. The results of short term storage at room temperature stability and freeze thaw cycles indicate no degradation of the selected drugs in plasma as well as in sample solution and hence plasma samples could be handled without special precautions. Stability data are given table 2.
In conclusion, the developed method for the estimation of VEN in plasma is accurate, precise, selective and linear and hence can be applied for bioavailability and bioequivalence studies.
Application of the developed method
The developed method was applied to the determination of VEN in plasma samples from an on going project of bioequivalence study of a sustained release formulation. Open label, balanced, randomized, two-treatment, two sequence, two-period, single dose, crossover bioequivalence study of the marketed capsules containing 75 mg of VEN (reference) against VEN 75 mg capsules (test) manufactured by Sipali Chemicals, India, was conducted in healthy, adult, male, human subjects under fasting conditions in accordance with the current good clinical practice (cGCP) and FDA guidelines . The study was performed on healthy, willing, 24 male volunteers of 18–45 years age, after they had been informed of the purpose, protocol and risk involved in the study. All subjects gave written informed consent and the protocol was approved by the institute ethics committee. The venous blood samples, (6mL, including 1mL discarded heparinised blood) were withdrawn via an indwelling cannula at pre-dose and at 0.5,1.0,1.5,2.0,3.0,4.0,6.0,8.0,12.0,18.0 and 24 h following drug administration in each period of the study. The samples were collected in pre-labeled vacutainers containing sodium citrate as the anti-coagulant and centrifuged at 3000 rpm for 15 min at 15 °C and the plasma was collected in pre-labeled sample collection tube. A wash out period of 7 days was observed between the two phases of the study. The samples were stored in the deep freezer at −70±5 °C until analyzed by a validated LC-MS method.
The pharmacokinetic parameters, namely, maximum plasma concentration (Cmax), time point of maximum plasma concentration (Tmax), area under the plasma concentration–time curve from 0 h to the last measurable concentration (AUC0–t), area under the plasma concentration time curve from 0 h to infinity (AUC0–∞), elimination rate constant (keli) and half-life of drug elimination during the terminal phase (t1/2) were calculated using PK solution Software. Statistical analysis of the pharmacokinetic parameters was carried out using SPSS 12.0.1 for un-transformed and in-transformed pharmacokinetic parameters, namely Cmax, AUC0–t and AUC0–∞. Based on the statistical results of 90.0% confidence intervals for the ratios of the means of in-transformed pharmacokinetic parameters, namely Cmax, AUC0–t and AUC0–∞, a conclusion was drawn as to whether the test product was bioequivalent to the reference product. Bioequivalence was to be concluded, if the 90.0% confidence interval fell within the bioequivalence range 80.0–125.0% for Cmax, AUC0–t and AUC0–∞. (3).
The mean (±S.D) plasma maximum concentration obtained for VEN in reference and test formulation is 100.89 (10.52) ng mL and 94.48 (12.55) ng mL, respectively (Table 3) The mean VEN plasma concentration–time profile following a 75 mg oral dose of VEN to human subjects is shown in (Fig. 6). The results of the statistical analysis indicate that the test and the reference formulation are bioequivalent as evident from Table 4.
CONCLUSION:
A simple, specific, rapid and sensitive analytical method for the determination of VEN in human plasma has been developed. The method provided excellent specificity and linearity with a limit of quantification of 5.0 ng mL for VEN. The developed LC–MS method was successfully applied for the bioequivalence studies. The statistical analysis of pharmacokinetic parameters obtained for the test and reference formulations administered in the study are bioequivalent in terms of rate and extent of absorption.
Fig. 1
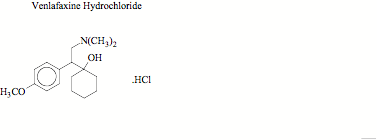
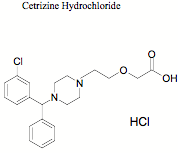
Fig. 2
Sample Chromatogram of VEN and Internal standard
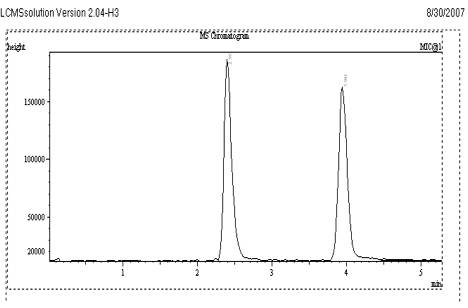
Fig. 3
Chromatogram of Blank plasma sample
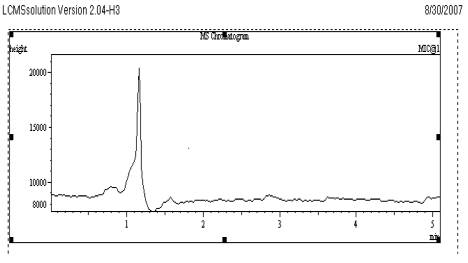
Fig. 4
Mass Spectrum of VEN at Positive mode Scan
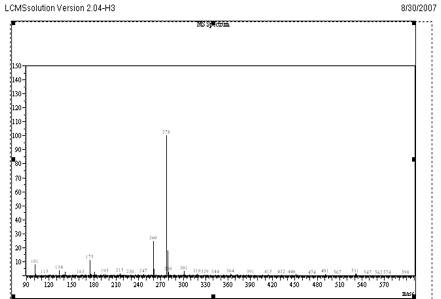
Fig. 5
Mass Spectrum of CET at Positive mode Scan
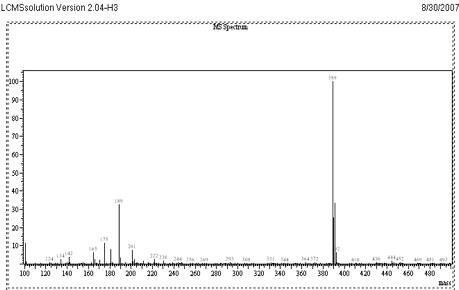
Fig. 6
Mean plasma conentration – time curves from 24 subjects for Test and Reference
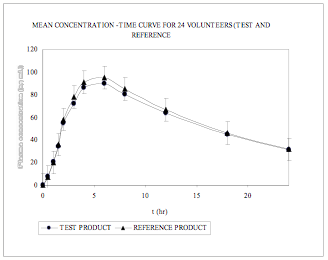
Table 1
Precision studies of VEN (ng mL-1)
![]()
Quality control Nominal Intra-assay SD % CV N Inter -assay SD % CV N
![]()
![]() Samples Concentration
Samples Concentration
Mean concentration Mean Concentration
Found (ng mL-1) Found (ng mL-1)
![]()
LLOQ 5.0 4.762 0.4245 8.92 5 4.452 0.1480 3.32 5
LQC 20.0 18.166 1.5355 8.45 5 17.174 0.2354 1.37 5
MQC 100.0 86.886 1 .4420 1.66 5 86.892 1.1118 1.27 5
HQC 200.0 175.342 2.6888 1.53 5 178.002 4.1026 2.30 5
![]()
S.D.-standard deviation,
CV-coefficient of variance,
N-total number of observations for each concentration.
LLOQ- Lower Limit of Quantification
LQC - Lower Quality Control
MQC - Middle Quality Control
HQC - High Quality Control
Table 2
Stability of human plasma samples of VEN
![]()
Sample concentration Concentration found % CV
(ng mL-1) (n = 6) (mean ± S.D.) (ng mL-1)
![]()
Short-term stability (1, 2, 3 h)
20 17.326 ± 0.6578 3.76
100 86.438 ± 1.7516 2.02
200 176.290 ± 4.2475 2.40
Long-term stability (4 weeks)
20 18.426 ± 0.8102 4.39
100 88.004 ± 3.6177 4.11
200 178.408 ± 8.693 4.87
Stock Solution Stability (7, 14,21Days)
20 20.462 ± 0.8658 4.23
100 98.416 ± 1.0811 1.09
200 197.420 ± 2.083 1.05
Freeze thaw Stability (3 Cycle)
20 17.208 ± 0.4883 2.83
100 85.446 ± 1.8098 2.11
200 173.292 ± 5.1351 2.96
![]()
Table 3
Mean Pharmacokinetic properties of VEN obtained from study subjects (N = 24) after administration of a single 75-mg dose of reference and test VEN formulations.
![]()
Pharmacokinetic parameters* Test Reference
(n=24) (n=24)
![]()
Cmax, ng mL-1 94.48 (12.55) 100.89 (10.52)
tmax, h 5.58 (1.02) 5.79 (1.25)
AUC0–t (ng.h mL-1) 1374.00(136.92) 1441.00 (114.61)
keli 0.06 (0.01) 0.06 (0.01)
AUC0–α (ng.h mL-1) 1921.71(261.53) 1967.14 (210.77)
t1/2 (h) 11.92 (2.28) 11.27 (2.04)
![]()
Tmax: time of maximum concentration,
Cmax: maximum concentration,
AUC: area under the concentration time curve,
T1/2: Half-life,
keli: elimination rate constant,
AUC0–t: area under the plasma concentration–time curve, last available measurement;
AUC0–α : area under the plasma concentration–time curve from time 0 to infinity;
* Values in the parenthesis indicate standard deviation.
Table 4
Results of statistical analysis of the Bioequivalence study of VEN test and reference formulation
![]()
AUC0–t (ng.h/mL-1) AUC0– α (ng.h/mL-1) Cmax, (ng mL-1)
![]()
Ratio (%) 105.00 102.6 107.10
![]() 90% Geometric CI (%) 100.77 – 106.33 96.19- 102.85 95.70-104.57
90% Geometric CI (%) 100.77 – 106.33 96.19- 102.85 95.70-104.57
REFERENCES
1. Christine Frahnert, Analysis of eighteen antidepressants, four atypical antipsychotics and active metabolite in serum by liquid chromatography: a simple tool for therapeutic drug monitoring J.Chromatogr. B, 794: 35–47 (2003).
2. FDA Guidance for Industry, Bioavailability Studies for Orally Administered Drug: Products-General Considerations, US Department of Health and Human Services, Food and Drug Administration, Centre for Drug Evaluation and Research (CDER), (2000).
3. FDA Guidance for Industry, Statistical Approaches to Establishing Bioequivalence, US Department of Health and Human Services, Food and Drug Administration, Centre for Drug Evaluation and Research (CDER), (2001).
4. FDA Guidance for Industry, Bioanalytical Method Validation, US Department of Health and Human Services, Food and Drug Administration, Centre for Drug Evaluation and Research (CDER), Center for Veterinary Medicine (CVM) May 2001.
5. He Juan, Simultaneous determination of fluoxetine, citalopram, paroxetine, venlafaxine in plasma by high performance liquid chromatography–electrospray ionization mass spectrometry J.Chromatogr. B, 820: 33–39 (2005).
6. Kabrena E Postmortem tissue concentration of venlafaxine Forensic Science International, 121: 70-75 (2001).
7. Kirchherr .H Quantitative determination of forty-eight antidepressants and antipsychotics in human serum by HPLC tandem mass spectrometry: A multi-level, single-sample approach J. Chromatogr. B, (2006).
8. Manfred Uhr Blood–brain barrier penetration and pharmacokinetics of amitriptyline and its metabolites in p-glycoprotein (abcb1ab) knock-out mice and controls Journal of Psychiatric Research (2005)
9. Matoga M Rapid high-performance liquid chromatographic measurement of venlafaxine
and O-desmethylvenlafaxin in human plasma Application to management of acute
intoxications. J. Chromatogr. B, 760: 213–218(2001).
10. Nichols An Open-Label, Randomized, Crossover Study Of The Relative Bioavailability Of Desvenlafaxine After Oral Administration Of Extended-Release Venlafaxine And Sustained-Release Desvenlafaxine Succinate In Healthy Subjects. American Society for Clinical Pharmacology and Therapeutics February P 86 (2005).
11. Sapna N. Stability indicating LC method for the estimation of venlafaxine in pharmaceutical
formulations Journal of Pharmaceutical and Biomedical Analysis 28 : 1055–1059 (2002).
12. N.Sapna, Once daily sustained release tablets of venlafaxine, a novel antidepressant European Journal of Pharmaceutics and Biopharmaceutics. 54: 9–15 (2002).
13. M.R.Sarah, Development of a solid phase extraction for 13 ‘new’ generation antidepressants
and their active metabolites for gas chromatographic–mass spectrometric analysis. J. Chromatogr. A, 1098: 19–29 (2005).
14. M.Steven and Troy, Bioavailability of Once-Daily Venlafaxine Extended Release
Compared With the Immediate-Release Formulation in Healthy Adult Volunteers
Current Therapeutic Research. 58: 8 (1997).
Copyright © Priory Lodge Education Limited 2007
First Published June 2007
Click
on these links to visit our Journals:
Psychiatry
On-Line
Dentistry On-Line | Vet
On-Line | Chest Medicine
On-Line
GP
On-Line | Pharmacy
On-Line | Anaesthesia
On-Line | Medicine
On-Line
Family Medical
Practice On-Line
Home • Journals • Search • Rules for Authors • Submit a Paper • Sponsor us
All pages in this site copyright ©Priory Lodge Education Ltd 1994-


