Browse through our catalogue of online Journals...
The response of Gut Associated Lymphoid Tissues (GALT) following oral administration of P. multocida B2 in rats
A.J. Awang-Hazmi*, A.B.Z. Zuki, M. Zamri-Saad and Saw Po Po
Faculty of Veterinary Medicine, Universiti Putra Malaysia 43400, Serdang,
Selangor Darul Ehsan, Malaysia
Keywords: Gut Associated Lymphoid Tissues (GALT), P. multocida B2, Macroscopic Evaluations, Microscopic Evaluations
ABSTRACT
The present study was conducted with the aim to investigate the response of GALT following oral administration of P. multocida type B2. Twelve adults, Spraque-Dawley rats which were divided into two groups (n=6) were used in this study. The rats in the first group were given 0.5ml 106 CFU of P. multocida type B2 orally by using stomach tube, while rats in the second group were given 0.5ml of normal saline using the same method and act as control. The rats of both groups were kept for 2 weeks with the feed and water were given ad-libitum. The rats were euthanised at day 14 post inoculation and macroscopic and microscopic evaluations were performed on each portion of intestines. Macroscopic evaluations revealed that there was no significance different (p>0.05) in the number and the length of the Peyer’s patches of each part of the intestine between the control and infected groups. The width of Peyer’s patches was significantly higher (p<0.05) in the control group as compare to the infected group. Microscopic examination revealed that the number of follicles was slightly higher in the infected group as compared to the control group. However, the different was not significant (p>0.05). The size (length and width) of lymphoid follicles, the number of intraepithelial lymphocytes (IEL) and plasma cells were significantly higher (P<0.05) in the infected group as compared to the control group. The present study demonstrated the significant morphological changes of Gut Associated Lymphoid Tissues (GALT) following oral administration of P. multocida B2 in rats.
INTRODUCTION
The mucosal immune system is located in a variety of different anatomical sites in which the external environment comes into contact with the host and has a complex role to play in protecting the host (Acheson and Lucioli, 2004). In the gastrointestinal tract, this system has the important role of preventing the uptake of agents that will cause harm, while at the same time allowing the passage of nutrients from the intestinal lumen into the systemic system (Acheson and Lucioli, 2004). Mucosal immunity has been largely investigated in the gut and gut-associated-lymphoid tissue (GALT) such as Peyer’s patches (Denise & Revaz., 2005). Pastuerella multocida is a Gram-negative bacterium, which is causative agent of wide range of diseases in animals. Healthy animals can harbour Pastuerella in the respiratory tract, especially around the nasopharynx and tonsilar region and called as carrier animal (Jubb et al., 1985). P. multocida strains can be separated into serogroups A,B,D,E and F based on the antigenicity of capsule (Carter, 1967; Rimler and Rhoades, 1987) and serotypes 1-16 based on LPS antigens ( Heddleston et al., 1972). Pastuerella multocida B:2 proved highly pathogenic to cattle, goats, sheep, rabbit, guinea pigs, mice and pigeons but not pathogenic to hens and ducks (Verma and Saxena, 1987). Healthy animals can harbour Pastuerella in the respiratory tract, especially around the nasopharynx and tonsilar region and called as carrier animal (Jubb et al., 1985). Recent work (Horadagoda et al 2001) demonstrated the development of rapid and severe endotoxaemia in the terminal stages of experimental disease induce with an intranasal inoculation of P. multocida serotype B:2 and indicated a primary role for endotoxin in the pathogenesis of Haemorraghic Septicaemia.
To our knowledge, the response of GALT following oral administration of P multocida type B2 has never been studied. Thus, this study was undertaken with the aim to evaluate the macroscopic and microscopic changes of GALT response to oral administration of Pastuerella multocida B2.
MATERIALS AND METHODS
Animals
Twelve adults, Spraque-Dawley rats weighing 200-250g were used in this study. The rats were divided into two groups consisted of 6 rats in each group. The rats were kept in cages and given commercial pellet and water ad-libitum. Rats in the first group were subjected to oral administration of P. multocida type B2, while rats in the second group were used as control and were given oral administration of normal saline. The protocol was approved by the Faculty’s Ethic Committee.
Preparation of P. multocida B2
P. multocida B2 used in this study has been first tested to examine the virulence of the bacteria. The bacteria have been diluted in normal saline and 3ml was injected via intraperitoneum into three healthy adult mice. All the mice were died within 24 hours of injection. After confirmation of the virulence of the bacterial, the bacterial culture was carried out on blood agar and the culture was incubated at 4°C for 24 hours. Identification, biochemical test, cell morphology and colony morphology were observed and examine. A single colony of bacteria from the culture was subcultured on blood agar and incubated for another 24 hours at the same temperature. The final step was to harvest all the bacteria from the colony in pure culture and wash three times with PBS solution by centrifugation. It was then wash with FPBS solution and standardized to 108 cells/ml bacteria using Mc Farland (0.5). Finally, dilution was done with PBS to get 106 CFU.
Innoculation Protocol
The rats were anaesthetized with an IM injection of ketamine (50 mg/kg) and xylazine (5 mg/kg). Under anaesthesia, the rats in the first group were given 106 CFU of killed P. multocida Type B2 in 0.5 ml phosphate buffered solution (PBS) orally using a stainless steel stomach needle (Popper®). The rats in the second group were given 0.5ml of normal saline orally using the same technique.
Gross examination
All the rats were euthanased with overdose of ketamine and xylazine at day 14 post-inoculation. Upon euthanasia, the small and large intestines of each rat were collected and examine macroscopically. The intestine was cut at the proximal end of duodenum and at the distal end of rectum. The intestinal contents were removed and washed with clean water. The intestinal lumen was then inserted with 10% buffered formalin and then the whole intestine was soaked into the solution for 30 minutes. The intestine was then cut open along the mesenteric border and the mucosal surface was examined. The number and size of follicles at each part of intestine were counted, measured and recorded.
Microscopic examination
The intestine was divided into 6 portions: the duodenum, jejunum, ileum, cecum, colon and rectum. Three samples were taken from each portion (the proximal, middle and distal parts) and fixed in 10% buffered formalin and process for histological examination. The tissues were sectioned at 0.4µ using Microtome (Leica 2045). The sections were then stained with Harris Hematoxylin & Eosin (H&E) and Methyl green pyronin. The number and size of follicle, intraepithelial lymphocyte (IEL) of villi and crypts were counted and recorded by using image analyzer (Synoptic Inc., UK). The Methyl green pyronin sections were used for plasma cell count.
Statistical Analysis
All the data were analysed using Independent T-Test and One Way ANOVA. This was done using SPSS software, Version 11.0. The statistical analysis was based on the comparison between the groups (using Independent T-Test) and comparison within the groups (using One Way ANOVA). The data were considered significant at P<0.05.
RESULTS
Macroscopic Evaluations
Number of Peyer’s Patches
The results of Peyer’s patches count is shown in Figure 1. The total number of Peyer’s patches was slightly higher in the infected group, however, the different was not significant (p>0.05). The average number of Peyer’s patches in the control and infected groups was 16.33 and 18.167 respectively. The number of Peyer’s patches in each intestinal section showed there were significance difference (p<0.05) between the ileum, caecum and rectum of the control and infected group as shown in Figure 2. In both the infected and control groups, the number of Peyer’s patches was higher in the jejunum of small intestine (8.33±0.955 and 7.33±1.520 respectively) and lowest in caecum (1.00±0.258 and 0.17±0.167 respectively) and rectum (0.67±0.211 and 0.33±0.211 respectively).
Length of Peyer’s Patches
The total mean length of Peyer’s patches between control and infected groups was not significantly different (p>0.05) (Figure 3). Similarly, the length of Peyer’s between each intestinal section was also not significantly different (p>0.05).The length of Peyer’s patches of large intestine was higher than the small intestine but the caecum and rectal part was not significantly different (p>0.05), except for the colon where the length of the Peyer’s patches in infected group (0.500±0.0369 cm) was significantly higher (p<0.05) than of the control group (0.450±0.0669 cm) as shown in Figure 4.
Width of Peyer’s Patches
The total mean width of Peyer’s patches of control group (0.532±0.0172 cm) was not significantly higher (p>0.05) than the infected group (0.462±0.0106 cm) (Figure 5). There was no significant different (p>0.05) of width of Peyer’s patches of intestinal section between control and infected group, except for jejunum (0.504±0.0143 cm and 0.48±0.0136 respectively) and colon (0.357±0.0377 cm and 0.367±0.0284 cm respectively) (Figure 6).
Microscopic Evaluations
Number of Lymphoid Follicles
The total mean number of lymphoid follicles in the infected (2.32±0.87) and control (2.07±0.96) groups was not significantly different (p>0.05) (Figure 7). The mean number of lymphoid follicles in each intestinal section between the control and infected groups was also not significantly different (p>0.05) (Figure 8).
Length of Lymphoid Follicles
The total mean length of lymphoid follicles in infected group (99.763±0.0236µ) was significantly higher (p<0.05) than the control group (99.213 ±0.0668µ) (Figure 9). The mean length of lymphoid follicles in each intestinal section between the control and infected groups also showed significance difference (p<0.05) except for the rectum (Figure 10).
Width of Lymphoid Follicles
The total mean width of lymphoid follicles in infected group (99.562 ±0.0192µ) was significantly higher (p<0.05) than the control group (98.958±0.0750µ) as showed in Figure 11. Similarly, the width of lymphoid follicle in each intestinal section in infected group was significantly higher (p<0.05) than the control group except for the rectum (Figure 12).
Number of Intraepithelial Lymphocytes (IEL)
The total mean number of IEL in infected group (16.75±0.140) was significantly higher (p<0.05) than the control group (10.86±0.184) (Figure 13). The mean number of IEL in each intestinal section of the control group were significantly higher (p<0.05) than the infected groups (Figure 14).
Number of Plasma Cells
Total mean number of plasma cells was significantly higher (p<0.05) in infected group (47.99±1.070) as compared to control group (35.54±0.994) (Figure 15). The mean number of plasma in each intestinal section of the control group were significantly higher (p<0.05) than the infected groups (Figure 16).
(iii) DISCUSSION
The macroscopic evaluation in this study revealed that the number and the length of Peyer’s patches (PP’s) between the control and infected groups was not significantly different (p>0.05). However, the width of the Peyer’s patches of control group was significantly higher (p<0.05) as compared to the infected group. Even though the number and length of Peyer’s patches was not significantly different, it still higher in infected group as compared to the control group. The number of PP’s decreased toward distal part of the intestines. The PP’s were numerous in the small intestine especially in the jejunum. This may because the jejunum is the longest part of the intestine. Similarly, in human the PP’s were found numerous in the distal portion of small intestine including the jejunum (Cornes, 1965). The number (Cornes, 1965) and size of Peyer’s patches was gradually reduced with increasing age. In lamb of the same age, individual variation of the size of Peyer’s patches also exist (Lie et al., 2005). Thus, this study found that the GALT has no significant response following oral administration of P. multocida B2 macroscopically.
Microscopically, there was no significant different (p>0.05) in the number of lymphoid follicles between the control and infected groups. Even though the difference was not significant, the number of lymphoid follicles was higher in each intestinal section of the infected group. The study revealed that there was significant different (p<0.05) in size (length and width) of lymphoid follicles between the control and infected group. The number of intraepithelial lymphocytes (IEL) and plasma cells between the control and infected groups were also significantly different (p<0.05). Thus, the microscopic evaluation revealed that the GALT was response to the oral administration of P. multocida B2.
The theory of the interactions of the bacterial pathogens to mucosal immune system (GALT) might help in explaining this finding. The primary role of GALT is to protect the body against microbes entering the body via intestinal tract. It is primarily made up of lymphoid aggregates and lymphoid cells between epithelial cells and within lamina propria. In order to distinguish between harmful invaders or harmless food, the gut has a ‘sampling’ mechanism that analyzes everything that has been ingested. The analytical, or antigen sampling machinery of the gut, consist of specialized epithelial cells, M cells, and intimately associated Antigen Presenting Cells (APC’s).
The number of intraepithelial lymphocytes in infected group was increased due to the present of P. multocida B2 antigen that lead to activation of inactivated lymphocytes. P. multocida B2 is pathogenic to respiratory tract especially when animals were in stress. These bacteria will lead to detrimental effects to ruminants during rainy season in South East Asia. In this experiment, P. multocida B2 also induce response to the mucosal line of intestinal tract even though it was not significance macroscopically. The mucosal line of intestinal tract will recognize these bacteria as foreign microorganisms and induces response against it. Intraepithelial lymphocytes that reside at basolateral site regulate the proliferation and differentiation of epithelial cells for providing a first line of host defense in intestine (Ohara et al 2005). The proliferation and differentiation of the lymphocytes into plasma cells and memory B lymphocytes will increase in number of lymphocytes in the GALT (Paul and Seder, 1994). Recent immunohistological studies in mice have elucidated regional and quantitative differences within the small intestine between intraepithelial lymphocytes (IEL) and lamina propria lymphocytes (LPL) (Yaguchi et al., 2004). The increase in IEL will reflect the number of plasma cells, where the increase in IEL will lead the increment of plasma cells number. This is because, the plasma cells derived from proliferation and differentiation of B lymphocytes. The plasma cells secrete antibodies that act specifically against P. multocida B2 antigen. A few studies in human have found that in chronic gastritis, plasma cells of all isotypes increase (Brandtzaeg, 1987) and epithelial T-cells (lymphocytes) also increase. The increase in numbers of inflammatory cells and antigen presenting cells (APC’s) in GALT following oral administration of P. multocida B2 will lead to increase of the size or hyperplasia of the lymphoid follicles itself. The lymphoid follicles will expand in length and width due to the flooding of the inflammatory cells and APC’S into the follicles.
REFERENCES
Acheson, D.W.K. and Lucioli, S. (2004). Mucosal immune responses. Best Practice and Research Clinical Gastroenterology, 18: 387-404.
Carter, G.R, 1967. Pasturellosis : Pastuerella multocida and Pastuerella hemolytica. Advance Veterinary Science, 11: 321-379.
Cornes, J.S. (1965). Number, size and distribution of Peyer’s patches in the human small intestine. Gut, 6: 225-233.
Denise, N-H. and Revaz, V. (2005). The important of mucosal immunity in defense against epithelial cancers. Current Opinion in Immunology, 17: 175-179
Heddlesteon, K.L, Gallagher, J.E, Rebers, P.A. 1972. Fowl cholera: gel diffusion precipitation test for serotyping Pastuerella multocida from avian species. Avian Diseases, 16: 925-936.
Horadagoda. N.U, Hodgson, J.C, Moon, G.M., Wijewardana, T.G & Eckersall , P.D (2001) Role of endotoxin in the pathogenesis of Haemorrhagic Septicaemia in the buffalo. Microbial Pathogenesis, 30: 171-178.
Jubb, K.V.F., Kennedy, N.P.C. and Palmer, N. (1985). Pathology of Domestic Animals. 2nd ed., Vol. 2. Academic Press. New York.
Lie, K.I., Aleksandersen, M., and Landsverk, T, (2005). Lymphoid follicles of different phenotype appear in ileum during involution of the sheep ileal Peyer’s patch. Developmental & Comparative Immunology, Volume 29, Issue 6, P 538-553.
Ohara, I.K., Sawaguchi, A., Suganuma, T., Matsuzaki, G., and Nawa Y., (2005). Intraepithelial lymphocytes express junctional molecules in murine small intestine. Biochemical and Biophysical Research Communications, Volume 331, Issue 4, P 977-983
Paul, W.E., Seder, R.A., (1994). Lymphocyte response and cytokines. Cell, Volume 76, Issue 2:241-245
Rimler, R.B., Rhoades, K.R., (1987). Serogroup F, a new capsule serogroup of Pastuerella multocida. Journal of Clinical Microbiology, 25: 615-618
Verma, N.D., Saxena, S.C., 1987. An outbreak of swine pasturellosis on an organized farm of Northern-Eastern Hills Region. India Journal of. Animal Science, 57: 528-532.
Brandtzaeg, P.E., (1987). Immune barriers of the mucous membrane of the upper respiratory and digestive tracts. Erratum in: Laryngol Rhinol Otol (Stuttg)., 66(9):512.
Yaguchi, K., Kayaba, S., Soga, H., Yamagishi, M., Tamura, A., Kasahara, S., Ohara, S., Satoh, J., Oka, Y., Toyota, T,, Itoh, T., (2004). DNA fragmentation and detachment of enterocytes induced by anti-CD3 mAb-activated intraepithelial lymphocytes. Cell Tissue Responses. 315(1):71-84
FIGURES
Peyer’s Patches Count
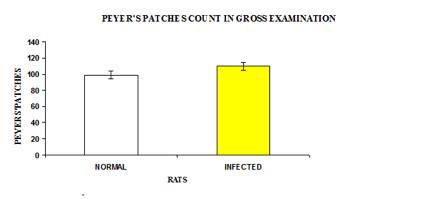
Figure 1: Total number of Peyer’s patches in control and infected rats.
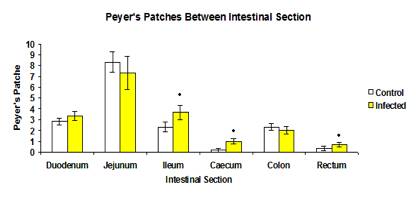
Figure 2: Mean number of Peyer’s patches between each intestinal section in control and infected rats.
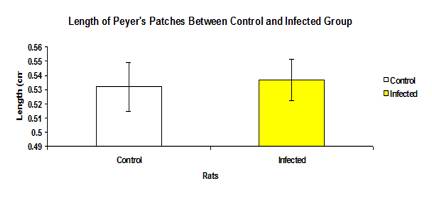
Figure 3: Mean length of Peyer’s patches between control and infected groups.
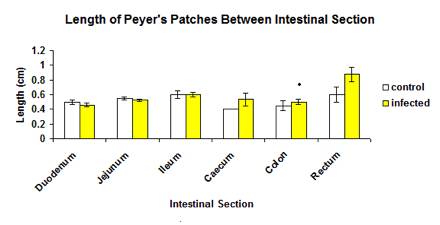
Figure 4: Mean length of Peyer’s patches between each intestinal section in control and infected groups.
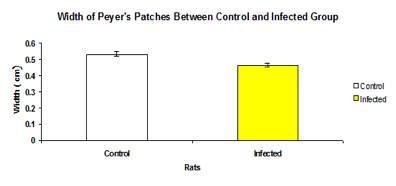
Figure 5: Total mean width of Peyer’s patches between control and infected groups.
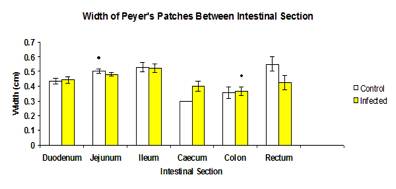
Figure 6: Mean width of Peyer's patches between each intestinal section of control and infected groups.
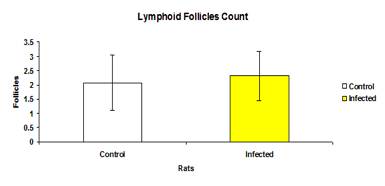
Figure 7: The total mean number of lymphoid follicles in control and infected groups.
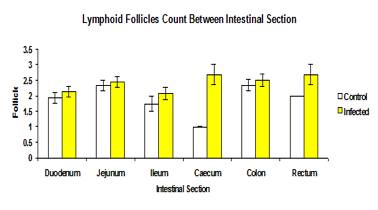
Figure 8: The mean number of lymphoid follicles of each intestinal section in control and infected groups.
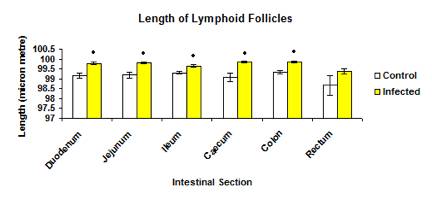
Figure 9: The mean length of lymphoid follicles in each intestinal section in control and infected groups.
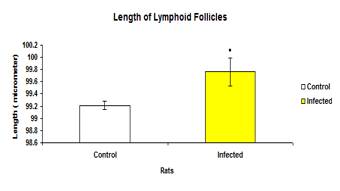
Figure 10: Total mean length of lymphoid follicles in control and infected groups.
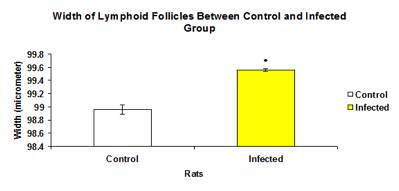
Figure 11: Total mean width of lymphoid follicles in control and infected groups.
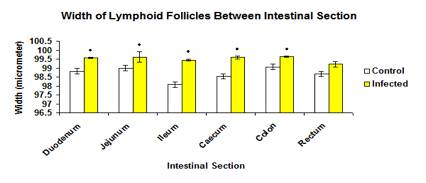
Figure 12: The width of lymphoid follicles of each intestinal section in control and infected groups.
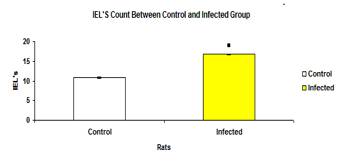
Figure 13: Total mean number of IEL of each intestinal section in control and infected groups.
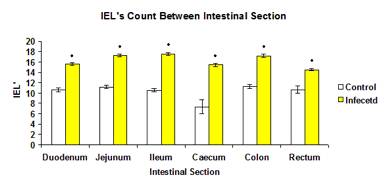
Figure 14: Mean number of IEL of each intestinal section in control and infected group.
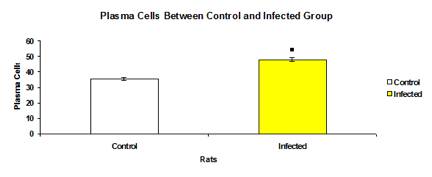
Figure 15: Total mean number of plasma cells in control and infected groups.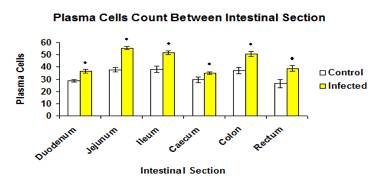
Figure 16: Mean number of plasma cells on each intestinal section in control and infected groups.