
![]()
We are pleased to publish the results of the composite survey this month.
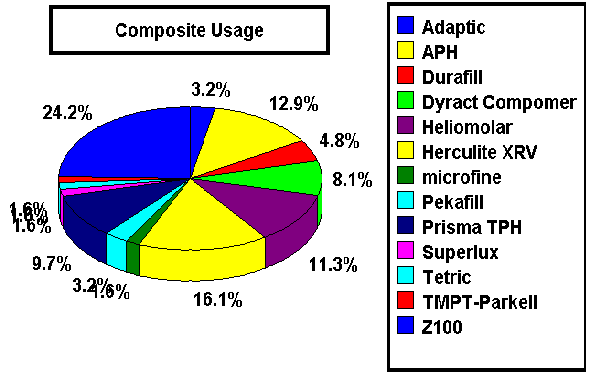
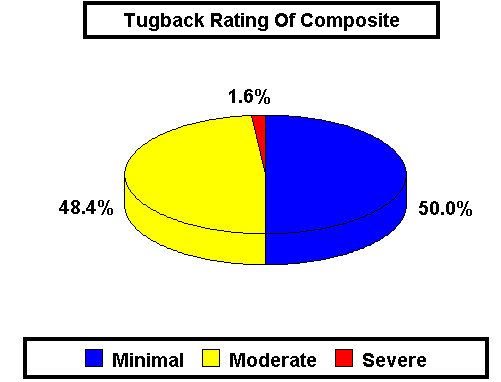
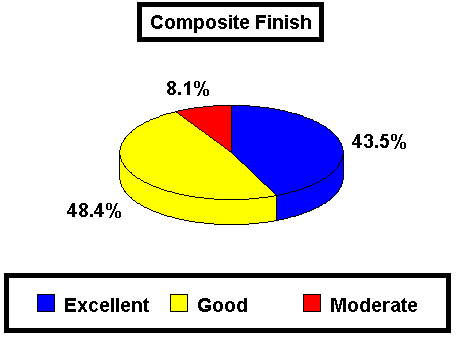
The following pie charts show the preferred composite, the overall
assessment of tugback and finish.
All data is represented as a percentage of responding dentists
4.8% of responding dentists chose the composite on price.
95.2% of responding dentists did not choose composite on price.
12.9% of responding dentists use a different composite on members of their family to that used on their patients.
32.8% of responding dentists used their chosen composite in
preference to amalgam;
67.2% did not.
Analysis of preferred Composite

Analysis of Tugback for all composites

Analysis of finish for all composite
s
We have also produced tugback and finish analysis for Z100, which proved to be the most popular composite.
Results for tugback and finish for herculite and APH are also available.
We are very interested in any ideas, news, general articles, personal opinion pieces, brief reports or scientific papers that you might care to submit for consideration to Dentistry On-Line. Please e-mail,The Editor, Dentistry On-line at dn47@CityScape.co.uk with any suggestions or comments.
All pages copyright ©Priory Lodge Education Ltd 1994-1999.